

After reading the headline above, a question arises. Is there a relationship between the stock market and the GDP? According to the international theory of the stock market, there is a direct relationship between the stock market and GDP.
The international theory of the stock market says that GDP and the stock market walk the same path by talking to each other. They walk the same path, but they never walk together. Some of them are before and some behind.
Another question arose. So who walks ahead and who follows? Again, the theory of the stock market says that when the stock market and GDP are on the same path, the stock market moves forward.
Another question arose. Why does the stock market move forward? To find the answer, it is necessary to know why the stock market grows.
The country’s economic situation helps the stock market grow the fastest. The stock market increases when the economic condition of any country improves. Whenever the country’s economic growth increases, at that time, the stock market increases. The first condition is that the country’s economic situation should improve to grow the stock market in real terms. So, shouldn’t the GDP go ahead of the stock market? At first glance, it may appear. It’s also natural. However, the stock market makes future “predictions” in advance. Since the stock market predicts the future in advance, it takes a step forward before GDP increases. For this reason, even if we continue on the same path, the stock market starts moving forward even before the GDP increases.
Just as the stock market increases even before GDP growth. Similarly, the stock market has already implemented measures to retreat when GDP growth contracts. Thus, the stock market and GDP follow a similar trajectory. This was demonstrated by comparing Nepal’s GDP growth rate and the NEPSE index.
Compare Nepal’s GDP growth percentage and NEPSE index on chart
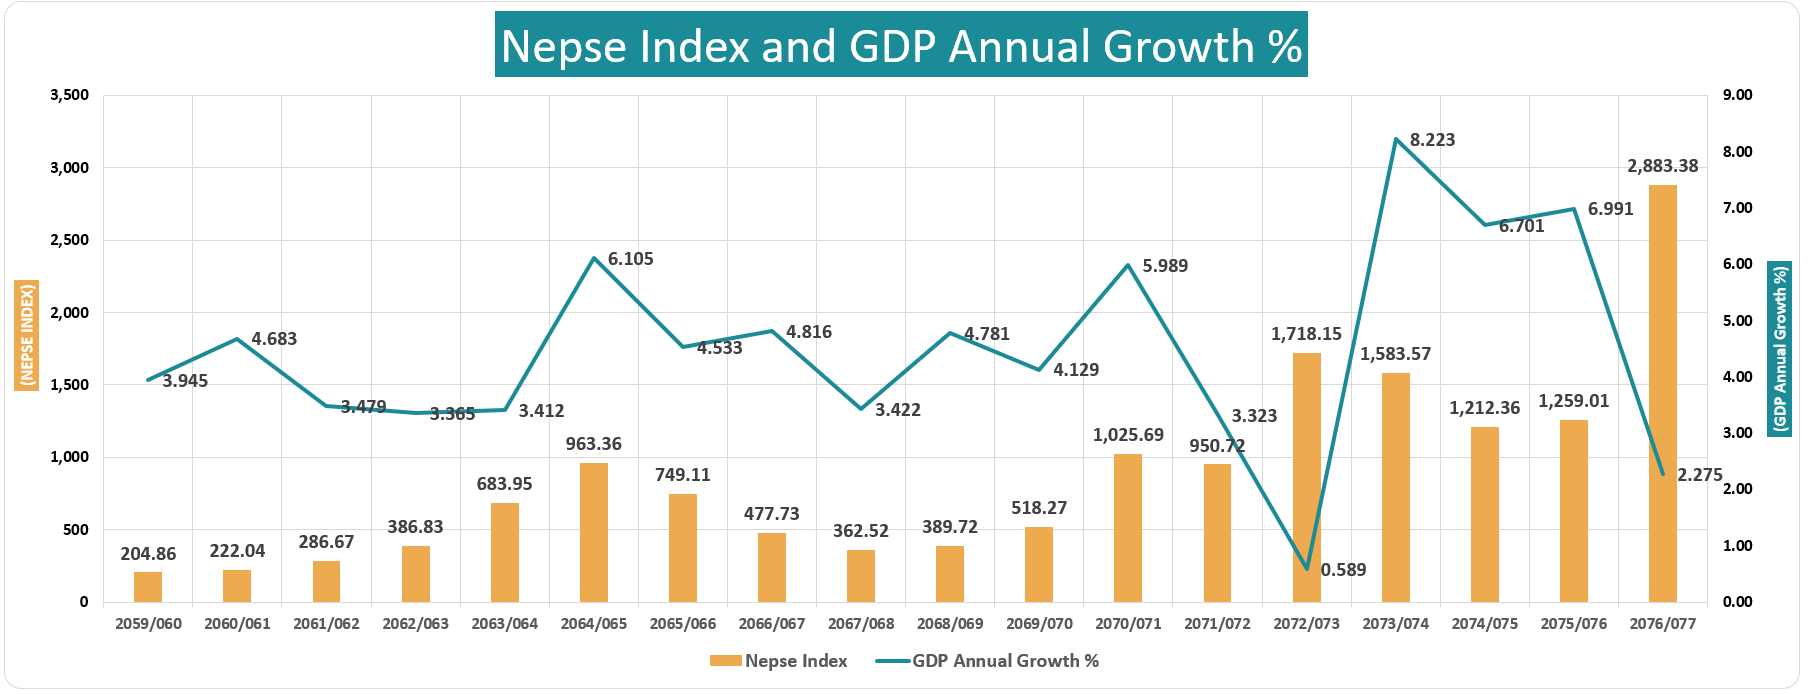
In the above chart, Nepal’s GDP growth percentage and NEPSE index have been compared over 18 financial years. In the first four years, Nepal’s GDP has not seen much growth. Even the NEPSE index does not seem to have a very big ‘entertainment’.
However, the NEPSE index seems to have started cashing in on the unexpected growth in the fiscal year 2064/65 a year ago. In the fiscal year 2064/65, Nepal’s GDP growth increased to 6.10 percent. Which was almost double that of the fiscal year 2063/64. While the GDP growth in 2063/64 was only 3.41 percent. However, the stock market had already started estimating GDP growth of 6.10 percent in the fiscal year 2064/65 from the fiscal year 2063/64. The index rose to 683.95 points that year. The index climbed to its highest level of 6.10 points in a year.
But the growth did not continue as it had. The NEPSE index had also predicted the same year that growth would not continue. Because the index, which reached a high point that year, has already started determining the declining rate on the chart. From the highest point, the more indicators decreased. It is seen in the chart that so much growth is also declining. Which establishes the above-mentioned topics.
However, the two candles on the chart do not establish the above issues. The fiscal years 2072/73 and 76/77 have not established the above issues. In those two financial years, GDP growth has fallen to a low point. However, both signals indicating the index have shown a record. To find an answer to why the candle was made in contrast to the above-mentioned year, one has to look back at the natural conditions of that year. First of all, looking back at the fiscal year 2072/73, there was a great earthquake in the country that year. Similarly, in 76/77, the country was in chaos due to the infection of COVID. In those two years, GDP and indicators have lost their way, according to the charts.
This proves that whenever there is a natural disaster in the country or natural disturbances, the investment environment all around deteriorates. Then investors come to the stock market looking for opportunities. Only then will the relationship between GDP and its indicators deteriorate. They deviate from the established path and begin walking in new directions. Which is not natural. After some time, the indicators and GDP, which have gone the opposite way, will return to their own rhythm. The life span of time when the opposite path is in power is very short.
The chart says that GDP growth is the first condition for the stock market to grow naturally. Another natural disaster sometimes leads to a surge in indicators. But it is temporary.
Similarly, another question may arise as to how GDP size and the total market capitalization of the stock market are related. Another assumption of the stock market says, “If the ratio of GDP size to the total market capitalization of the stock market falls between 50 percent and 75 percent, then the market can be said to have slightly devalued.” Also, if the ratio reaches between 75 percent and 90 percent, then the market should be considered valuable. If it goes above that, to 90 percent and 115 percent, then it should be seen as overvalued. On the other hand, there is no need to fear if the ratio goes up to 90 and 115. If growth continues at the same rate, the ratio can widen further. Because there are plenty of examples of the stock market increasing even as the ratio of the capitalization of the stock market to the GDP ratio in the global market is very high. But in Nepal, the above-mentioned ratio seems to have been maintained.
See market measurement index, market capitalization and GDP ratio chart
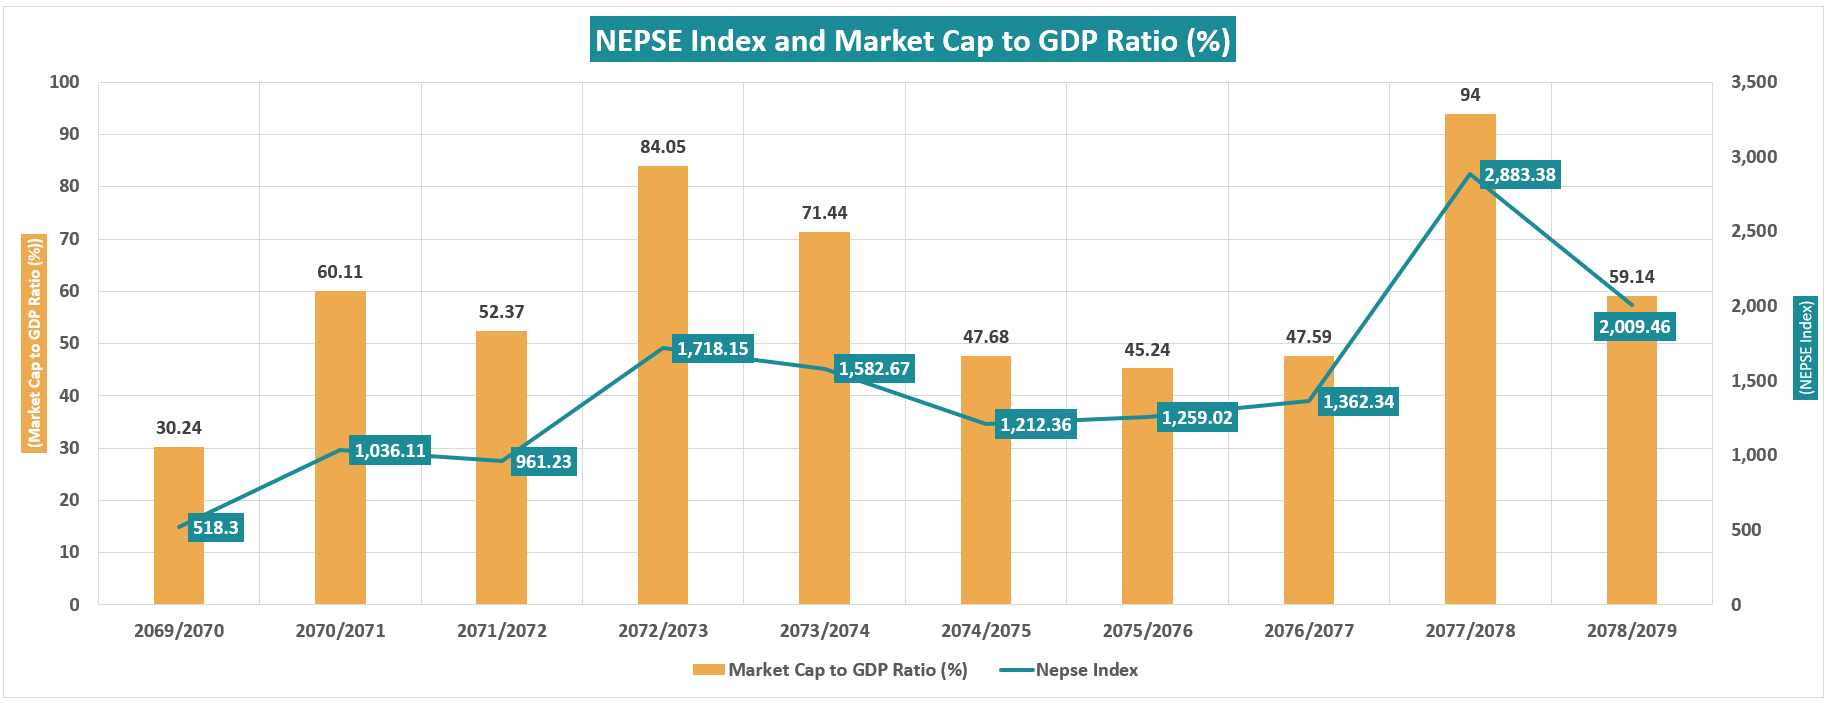
Based on the above-mentioned principles, the ratio of the total market capitalization of Nepal’s stock market and GDP has increased to 94 percent. That too is in FY 77/78.
In that year, the total market capitalization and GDP size of the stock market were equal. There would not have been much to fear until the growth increased in the coming year. But at that time, due to natural GDP growth, the index did not increase, but due to COVID, the index increased. As a result, market capitalization increased rapidly. GDP growth did not support this increment. As a result, the unnaturally increased ratio returned to its own rhythm. The current ratio can be attributed to a devaluation of the market.